Guide
How to Add the Data Analysis ToolPak in Google Sheets
If your statistics class assigns "Data Analysis ToolPak" problems, the instructions assume Excel: Data > Data Analysis, pick a tool, get a table. Google Sheets™ has no ToolPak and no Data Analysis button. You can still get every number, either with formulas or with an add-on that adds the same tools. This guide shows both, using one small example: test scores for six students taught by lecture (A2:A7) and six taught with a flipped classroom (B2:B7), with labels in row 1.
Does Google Sheets have the Analysis ToolPak?
No. The ToolPak is part of Excel, and Sheets has no built-in equivalent. Older tutorials send you to a ToolPak add-on; if the one you find opens with nothing but Help in its menu, it no longer runs. The two working routes are Sheets' own functions, below, or a current add-on such as Sumquill.
Descriptive statistics with formulas
The ToolPak's Descriptive Statistics table, one formula per row (for the lecture scores 72, 75, 68, 80, 77, 74):
- Mean
=AVERAGE(A2:A7)→ 74.3333 - Standard error
=STDEV(A2:A7)/SQRT(COUNT(A2:A7))→ 1.68655 - Median
=MEDIAN(A2:A7)→ 74.5 - Mode
=MODE(A2:A7)→ #N/A (no value repeats, the same answer Excel gives) - Standard deviation
=STDEV(A2:A7)→ 4.13118, and sample variance=VAR(A2:A7)→ 17.0667 - Kurtosis
=KURT(A2:A7)and skewness=SKEW(A2:A7) - Range
=MAX(A2:A7)-MIN(A2:A7)→ 12, plusMIN,MAX,SUMandCOUNT - Confidence level (95%)
=CONFIDENCE.T(0.05, STDEV(A2:A7), COUNT(A2:A7))→ 4.33541
For a quick look without formulas, select a column and choose Data > Column stats.
Regression with LINEST
Put the y values (the result) in one column and the x values (one or more predictors) beside it, then select an empty block five rows tall and enter =LINEST(C2:C13, A2:B13, TRUE, TRUE). The block fills with:
- Row 1: the coefficients, in reverse order (last x column first, intercept last). Row 2: their standard errors.
- Row 3: R squared and the standard error of the estimate. Row 4: the F statistic and the residual degrees of freedom. Row 5: the regression and residual sums of squares.
LINEST gives no p-values. For each coefficient, =T.DIST.2T(ABS(coefficient/standard_error), residual_df) gives its p-value. For a simple one-x regression, SLOPE, INTERCEPT and RSQ are quicker, and a scatter chart can show the line (Chart editor > Customize > Series > Trendline, with R² shown).
t-tests, correlation and histograms
- t-test:
=T.TEST(A2:A7, B2:B7, 2, 2). The third number is tails (1 or 2); the fourth is the type: 1 paired, 2 two-sample equal variances, 3 unequal variances. For our scores it returns 0.00131. Only the p-value comes back, not the t statistic or degrees of freedom the ToolPak table shows. - Correlation:
=CORREL(A2:A7, B2:B7)for one pair; a matrix means one CORREL per pair. - Histogram: select the data and choose Insert > Chart, then Histogram chart as the chart type. For the counts,
=FREQUENCY(data, bins).
ANOVA has no Sheets function at all; see how to do ANOVA in Google Sheets for the formulas.
The ToolPak tools in Google Sheets with Sumquill
- Open the Sumquill page on Google Workspace Marketplace and click Install, or in any spreadsheet choose Extensions > Add-ons > Get add-ons and search for Sumquill.
- Allow the permissions it asks for. Sumquill works only in the spreadsheet you open it in, and it sends no spreadsheet data anywhere.
- Back in your spreadsheet, open Extensions > Sumquill.
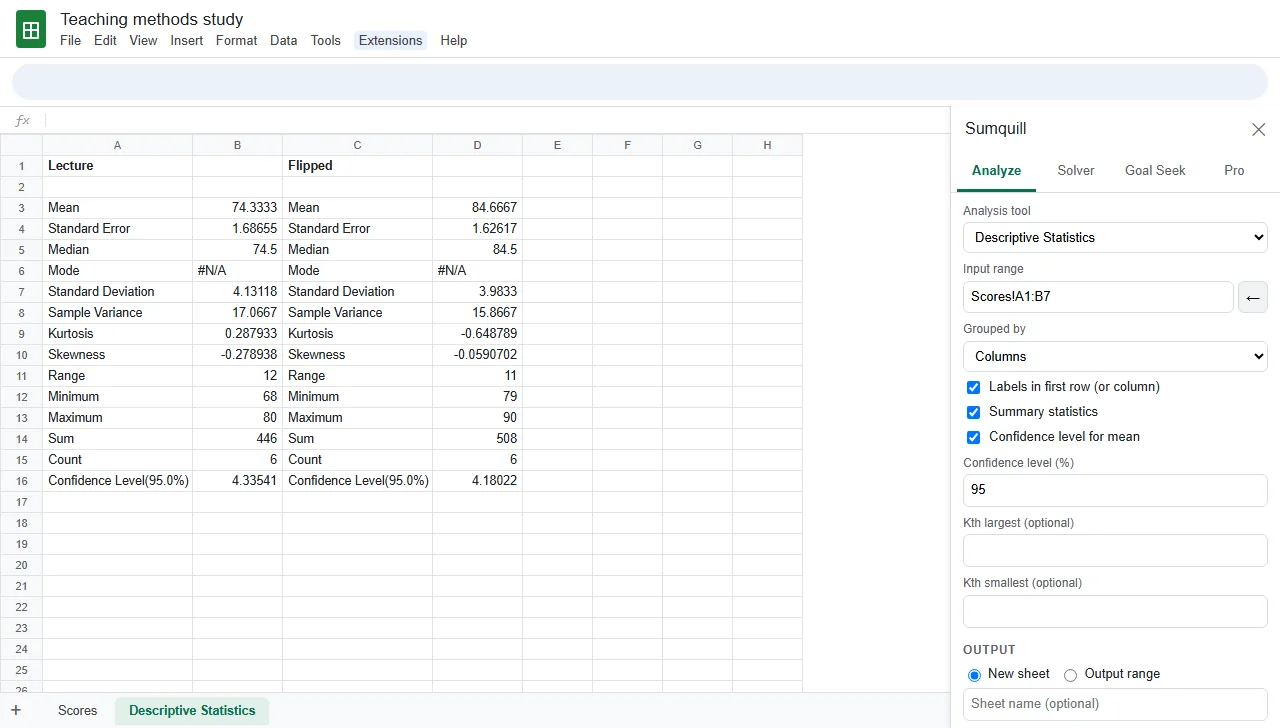
- Choose Extensions > Sumquill > Data analysis tools and pick a tool from the list.
- Click in Input range, select your data on the sheet, and click the ← button to fill it in. Tick Labels in first row if row 1 holds headings.
- Choose New sheet or an Output range and click Run. The results are ordinary cells you can format, chart and hand in.
The 18 tools: Descriptive Statistics, Histogram (with Pareto order, cumulative % and a chart), Correlation, Covariance, the three t-Tests, z-Test, F-Test, the three ANOVAs, Regression, Moving Average, Exponential Smoothing, Rank and Percentile, Sampling and Random Number Generation. Tests, ANOVA and regression also add a plain-English line, such as "The difference between group means is statistically significant (p = 0.0002 < 0.05)".
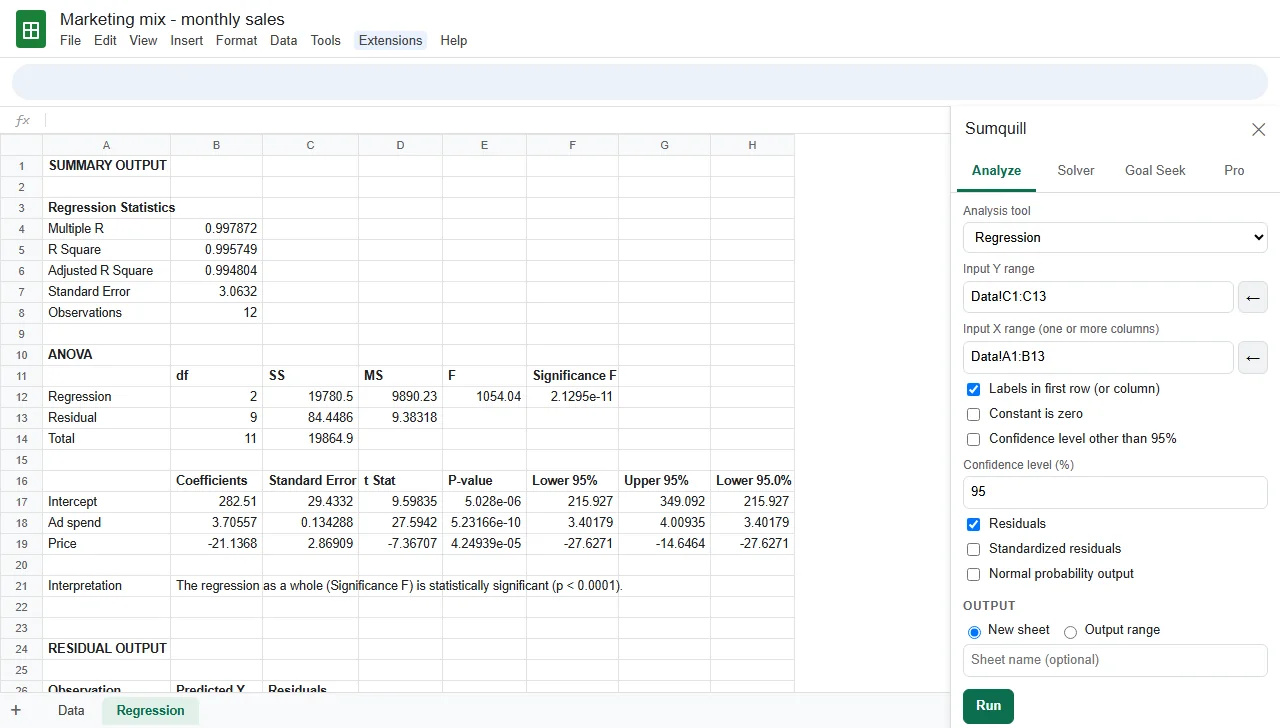
Descriptive Statistics, Histogram and Correlation are free, along with Goal Seek and Solver for models with up to 10 variable cells. Regression, the t-tests, ANOVA and the rest are Sumquill Pro: $3.99 a month, $29 a year, $49 once, or a $15 semester pass for students. If your answer differs from the book, check Labels in first row first: a heading read as data changes everything.
Excel is a trademark of Microsoft Corporation and Google Sheets™ of Google LLC. Sumquill is an independent product, not affiliated with or endorsed by Microsoft or Google.
Questions & answers
Does Google Sheets have a Data Analysis ToolPak?
No. The Analysis ToolPak is an Excel add-in, and Google Sheets has no built-in equivalent as of November 2026. You can do each analysis with Sheets formulas, or install an add-on such as Sumquill that adds the same tools under the Extensions menu.
How do I get descriptive statistics in Google Sheets?
Use one formula per statistic: AVERAGE, MEDIAN, MODE, STDEV, VAR, KURT, SKEW, MIN, MAX, SUM and COUNT, plus STDEV/SQRT(COUNT) for the standard error. For a quick look, Data > Column stats shows a summary of one column. Sumquill's Descriptive Statistics writes the whole table at once, free.
How do I run a regression in Google Sheets?
Use =LINEST(y_range, x_range, TRUE, TRUE) for the coefficients, standard errors, R squared and F statistic. LINEST doesn't give p-values; calculate them with T.DIST.2T. Sumquill's Regression tool writes the full Excel-style SUMMARY OUTPUT with p-values and residuals.
How do I do a t-test in Google Sheets?
Use =T.TEST(range1, range2, tails, type), with tails 1 or 2 and type 1 for paired, 2 for equal variances or 3 for unequal variances. It returns only the p-value.
Will my answers match the Excel ToolPak?
Sumquill writes the same tables in the same layout (SUMMARY OUTPUT, ANOVA and the t-Test tables), and its statistics are checked against NIST reference data, so the numbers should match your textbook's answer key.
Is Sumquill free?
Descriptive Statistics, Histogram, Correlation, Goal Seek, and Solver with up to 10 variable cells are free. The other tools are Sumquill Pro: $3.99 a month, $29 a year, $49 once, or a $15 semester pass for students.