Guide
How to Do ANOVA in Google Sheets (One-Way and Two-Way)
Google Sheets™ has no ANOVA function, and no Data Analysis menu to find one in. A one-way ANOVA is still only a handful of formulas, and this guide builds the full table step by step. The example: test scores for three teaching methods, six students each, with the method names in row 1.
- Lecture (A2:A7): 72, 75, 68, 80, 77, 74
- Flipped (B2:B7): 85, 82, 88, 79, 90, 84
- Online (C2:C7): 70, 76, 73, 69, 78, 72
The question one-way ANOVA answers: are the three group means really different, or could differences this size happen by chance?
One-way ANOVA with formulas
Put each group in its own column, as above. Then, in empty cells:
- Total sum of squares:
=DEVSQ(A2:C7)→ 714. DEVSQ adds up the squared distance of every score from the overall mean. - Within groups (SSW):
=DEVSQ(A2:A7)+DEVSQ(B2:B7)+DEVSQ(C2:C7)→ 224.667. The spread inside each group. - Between groups (SSB): total minus within → 489.333. The spread between the group means.
- Degrees of freedom: between = groups − 1 =
=COLUMNS(A2:C7)-1→ 2; within = scores − groups ==COUNT(A2:C7)-COLUMNS(A2:C7)→ 15. - Mean squares: MS between = 489.333 / 2 → 244.667; MS within = 224.667 / 15 → 14.9778.
- F: MS between / MS within → 16.3353.
- P-value:
=F.DIST.RT(16.3353, 2, 15)→ 0.000171. Use cell references instead of typed numbers. - F crit (alpha 0.05):
=F.INV.RT(0.05, 2, 15)→ 3.68232.
Lay those out in the usual table: rows Between Groups, Within Groups and Total; columns SS, df, MS, F, P-value and F crit. Add a SUMMARY block above it with each group's COUNT, SUM, AVERAGE and VAR (74.33, 84.67 and 73 for the means).
Reading the result
F (16.34) is far above F crit (3.68), and p = 0.0002 is below 0.05, so the difference between the teaching methods is statistically significant. ANOVA only tells you that some mean differs. To find which, compare pairs (here the flipped class is clearly the high one) with t-tests using a Bonferroni correction, or Tukey's test, whichever your course uses.
The test assumes the scores in each group are independent, roughly normal, and have similar spread. The three variances here (17.1, 15.9 and 12) are close enough.
Two-way ANOVA
A two-way ANOVA tests two factors at once, for example teaching method and class period, and whether they interact. By hand that means separate sums of squares for rows, columns, interaction and error, each with its own degrees of freedom. It can be done with SUMPRODUCT and AVERAGEIFS, but it's long and easy to get wrong, and it's where an add-on saves the most time. Lay the data out as Excel expects: the first factor down the rows, the second across the columns, labels in the first row and column; with replication, several rows per level (Sumquill asks for Rows per sample).
ANOVA in one click with Sumquill
- Open the Sumquill page on Google Workspace Marketplace and click Install, or in any spreadsheet choose Extensions > Add-ons > Get add-ons and search for Sumquill.
- Allow the permissions it asks for. Sumquill works only in the spreadsheet you open it in, and it sends no spreadsheet data anywhere.
- Back in your spreadsheet, open Extensions > Sumquill.
- Choose Extensions > Sumquill > Data analysis tools and pick Anova: Single Factor (or Two-Factor With Replication, or Without Replication).
- Select the data, including the labels row, and click ← to fill in the Input range. Leave Grouped by on Columns, tick Labels in first row, and keep Alpha at 0.05.
- Click Run.
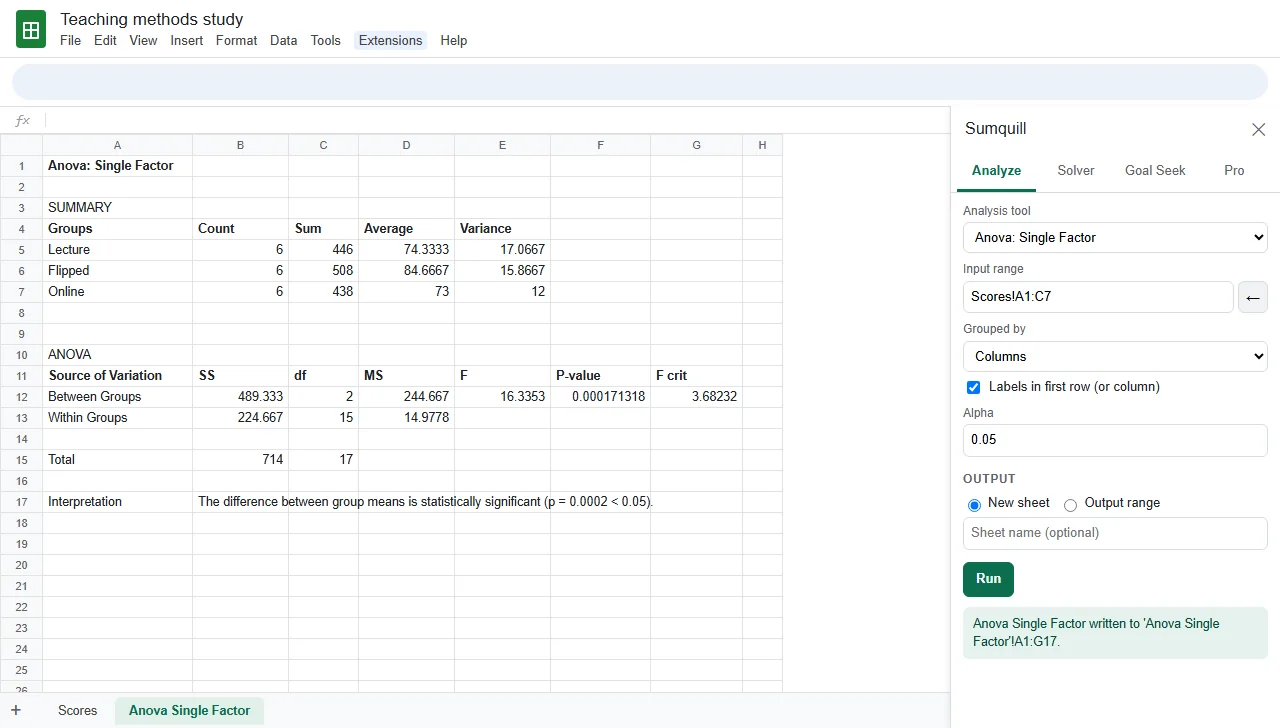
The table is written in Excel's layout, so it matches a textbook answer key line for line. ANOVA is part of Sumquill Pro ($3.99 a month, $29 a year, $49 once, or a $15 semester pass); the free tools include Descriptive Statistics, which gives you each group's mean and variance for checking the assumptions. For the other statistics formulas, see the Data Analysis ToolPak in Google Sheets.
Excel is a trademark of Microsoft Corporation and Google Sheets™ of Google LLC. Sumquill is an independent product, not affiliated with or endorsed by Microsoft or Google.
Questions & answers
Is there an ANOVA function in Google Sheets?
No. Sheets has no ANOVA function and no ANOVA tool as of November 2026. You can build the ANOVA table with DEVSQ, COUNT and F.DIST.RT, or use an add-on such as Sumquill, which writes Excel's Anova: Single Factor and two-factor tables.
How do I find the p-value for ANOVA in Google Sheets?
Calculate F = MS between / MS within, then use =F.DIST.RT(F, df_between, df_within). The critical value at alpha 0.05 is =F.INV.RT(0.05, df_between, df_within).
What does a significant ANOVA result mean?
That at least one group mean differs from the others. ANOVA doesn't say which one; follow up with pairwise comparisons, such as t-tests with a Bonferroni correction or Tukey's test, as your course teaches.
How should the data be laid out for one-way ANOVA?
One column per group, with the group name in the first row. Groups can have different numbers of values; leave the extra cells blank.
Can Google Sheets do a two-way ANOVA?
Not with a built-in function. By hand it means computing sums of squares for rows, columns, interaction and error. Sumquill's Anova: Two-Factor With Replication and Without Replication tools write the full table in the Excel layout.
Is ANOVA free in Sumquill?
ANOVA is part of Sumquill Pro: $3.99 a month, $29 a year, $49 once, or a $15 semester pass for students. Descriptive Statistics, Histogram, Correlation, Goal Seek and small Solver models are free.